Chytrá správa zeleně na základě dat
Efektivní péče o zeleň díky přesným datům, analýze a dlouhodobému monitoringu.
Služba umožňuje analyzovat stav vegetace pomocí multispektrálních dat, LiDARu a dalších technologií — od městských ploch přes krajinu až po zemědělské provozy. Výsledkem jsou srozumitelné mapy, trendy v čase a podklady pro rozpočet, zálivku a údržbu bez zbytečného plýtvání zdroji.
NDVI / indexy
stav porostu
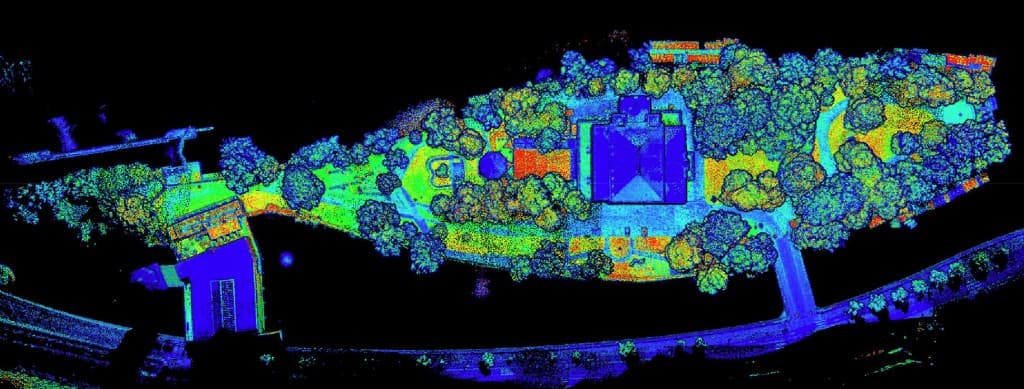
Let + LiDAR
kontext terénu
Časové řady
trendy
Cíl
Co služba řeší
Převádíme vegetaci z odhadu na měřitelné trendy — abyste věděli, kde zalévat, kde řezat a kde investovat jako první.
Zeleň reaguje na vodu, živiny, stín i zátěž návštěvnosti. Bez dat je snadné dělat rozhodnutí „od oka“ — s daty z leteckých měření a indexů vegetace získáte přehled o kondici porostu v čase, o rizikových místech a o efektu zásahů. Služba propojuje sběr, analýzu a výstupy tak, aby je používali jak technici údržby, tak management měst, správců areálů i zemědělské provozy.
Postup
Co služba zahrnuje
Od opakovatelného sběru přes vegetační indexy až po mapy a data připravená pro váš GIS.
Sběr dat
- multispektrální snímání
- drony
- LiDAR
- RGB
- monitoring
Analýza
- NDVI
- detekce stresu
- klasifikace
Výstupy
- mapy
- reporty
- GIS data
Aplikace
Využití
Stejná metodika měření — jiný kontext rozhodování podle typu lokality a provozu.
Města
Parky, sídliště, veřejná zeleň a stromořadí — přehled o kondici a prioritách údržby podle dat, ne podle pocitu.
Krajina
Větší celky, remízky a plochy s přírodním charakterem — trendy vitality a změn v čase.
Zemědělství
Plošné informace pro plánování zásahů, závlah a sledování stresu porostu v sezóně.
Hodnota
Přínosy
Tři směry, které dávají smysl jak ekonomicky, tak provozně — bez zeleného marketingového šumu.
Úspora
Cílené zásahy místo plošného „údržbářského“ přístupu — méně vody, hnojiva a práce tam, kde to reálně pomůže.
Efektivita
Jasný plán podle priorit a měřitelných trendů — méně chaosu v sezóně a při kontrolách.
Data-driven rozhodování
Podklady pro rozpočet, reporting a komunikaci s vedením i veřejností — srozumitelně a obhajitelně.
Deliverables
Výstupy
Od vizuálního přehledu po data připravená k další práci — podle vašeho GIS a interních procesů.
Mapy
přehledové vrstvy a tematické mapy pro plánování zásahů
Reporty
souhrny trendů, priorit a doporučení pro další období
GIS data
exporty ve struktuře pro vaše systémy a spolupráci v týmu
Stack
Technologie
Kombinujeme senzory podle cíle: od vitality zeleně přes geometrii až po podzemní kontext.
Multispektrální
indexy vegetace a rozlišení stavu porostu v širším kontextu
LiDAR
geometrie terénu a struktura porostu pro plánování přístupů
GPR
podzemní souvislosti tam, kde vstupují do plánování zásahů a výsadby
Termovize
teplotní kontrast a provozní stav vybraných ploch
Důvěra
Proč HORDRONES
Spolehlivé měření a srozumitelné výstupy — aby data nezůstala v prezentaci, ale fungovala v provozu.
Zkušenosti s leteckým měřením, prací s vegetačními indexy a předáním výstupů pro praxi.
Technologie skládané podle lokality — od městských ploch po zemědělský rozsah.
Přesnost georeference a konzistentní zpracování, aby šlo data v čase porovnávat.
Spolupráce
Balíčky služeb
Orientační struktura — rozsah vždy podle rozlohy, vegetace, frekvence letů a cílové přesnosti výstupů.
Basic
Vstup do datové správy zeleně
- ✓jednorázový přelet + základní indexy
- ✓mapový přehled a stručný report
- ✓export pro GIS dle dohody
Pro
Sezónní přehled a srozumitelné priority
- ✓opakované lety / monitoring
- ✓NDVI a analýza stresu v kontextu terénu
- ✓reporty pro údržbu a plánování zásahů
- ✓cloudové sdílení výstupů
Enterprise
Velké plochy a hlubší integrace
- ✓kombinace multispektrál + LiDAR + další vrstvy
- ✓napojení na interní GIS / workflow
- ✓pokročilá klasifikace a dlouhodobé řady
- ✓vlastní formáty reportingu a SLA
Data & zeleň
Chcete řídit zeleň na základě dat?
Navrhneme frekvenci měření, výstupy a strukturu dat tak, aby dávala smysl vašemu rozpočtu, GIS i reálné údržbě.
LET'S WORK TOGETHER
Send an inquiry — we will reply with a timeline and recommended approach.
Poptávka